


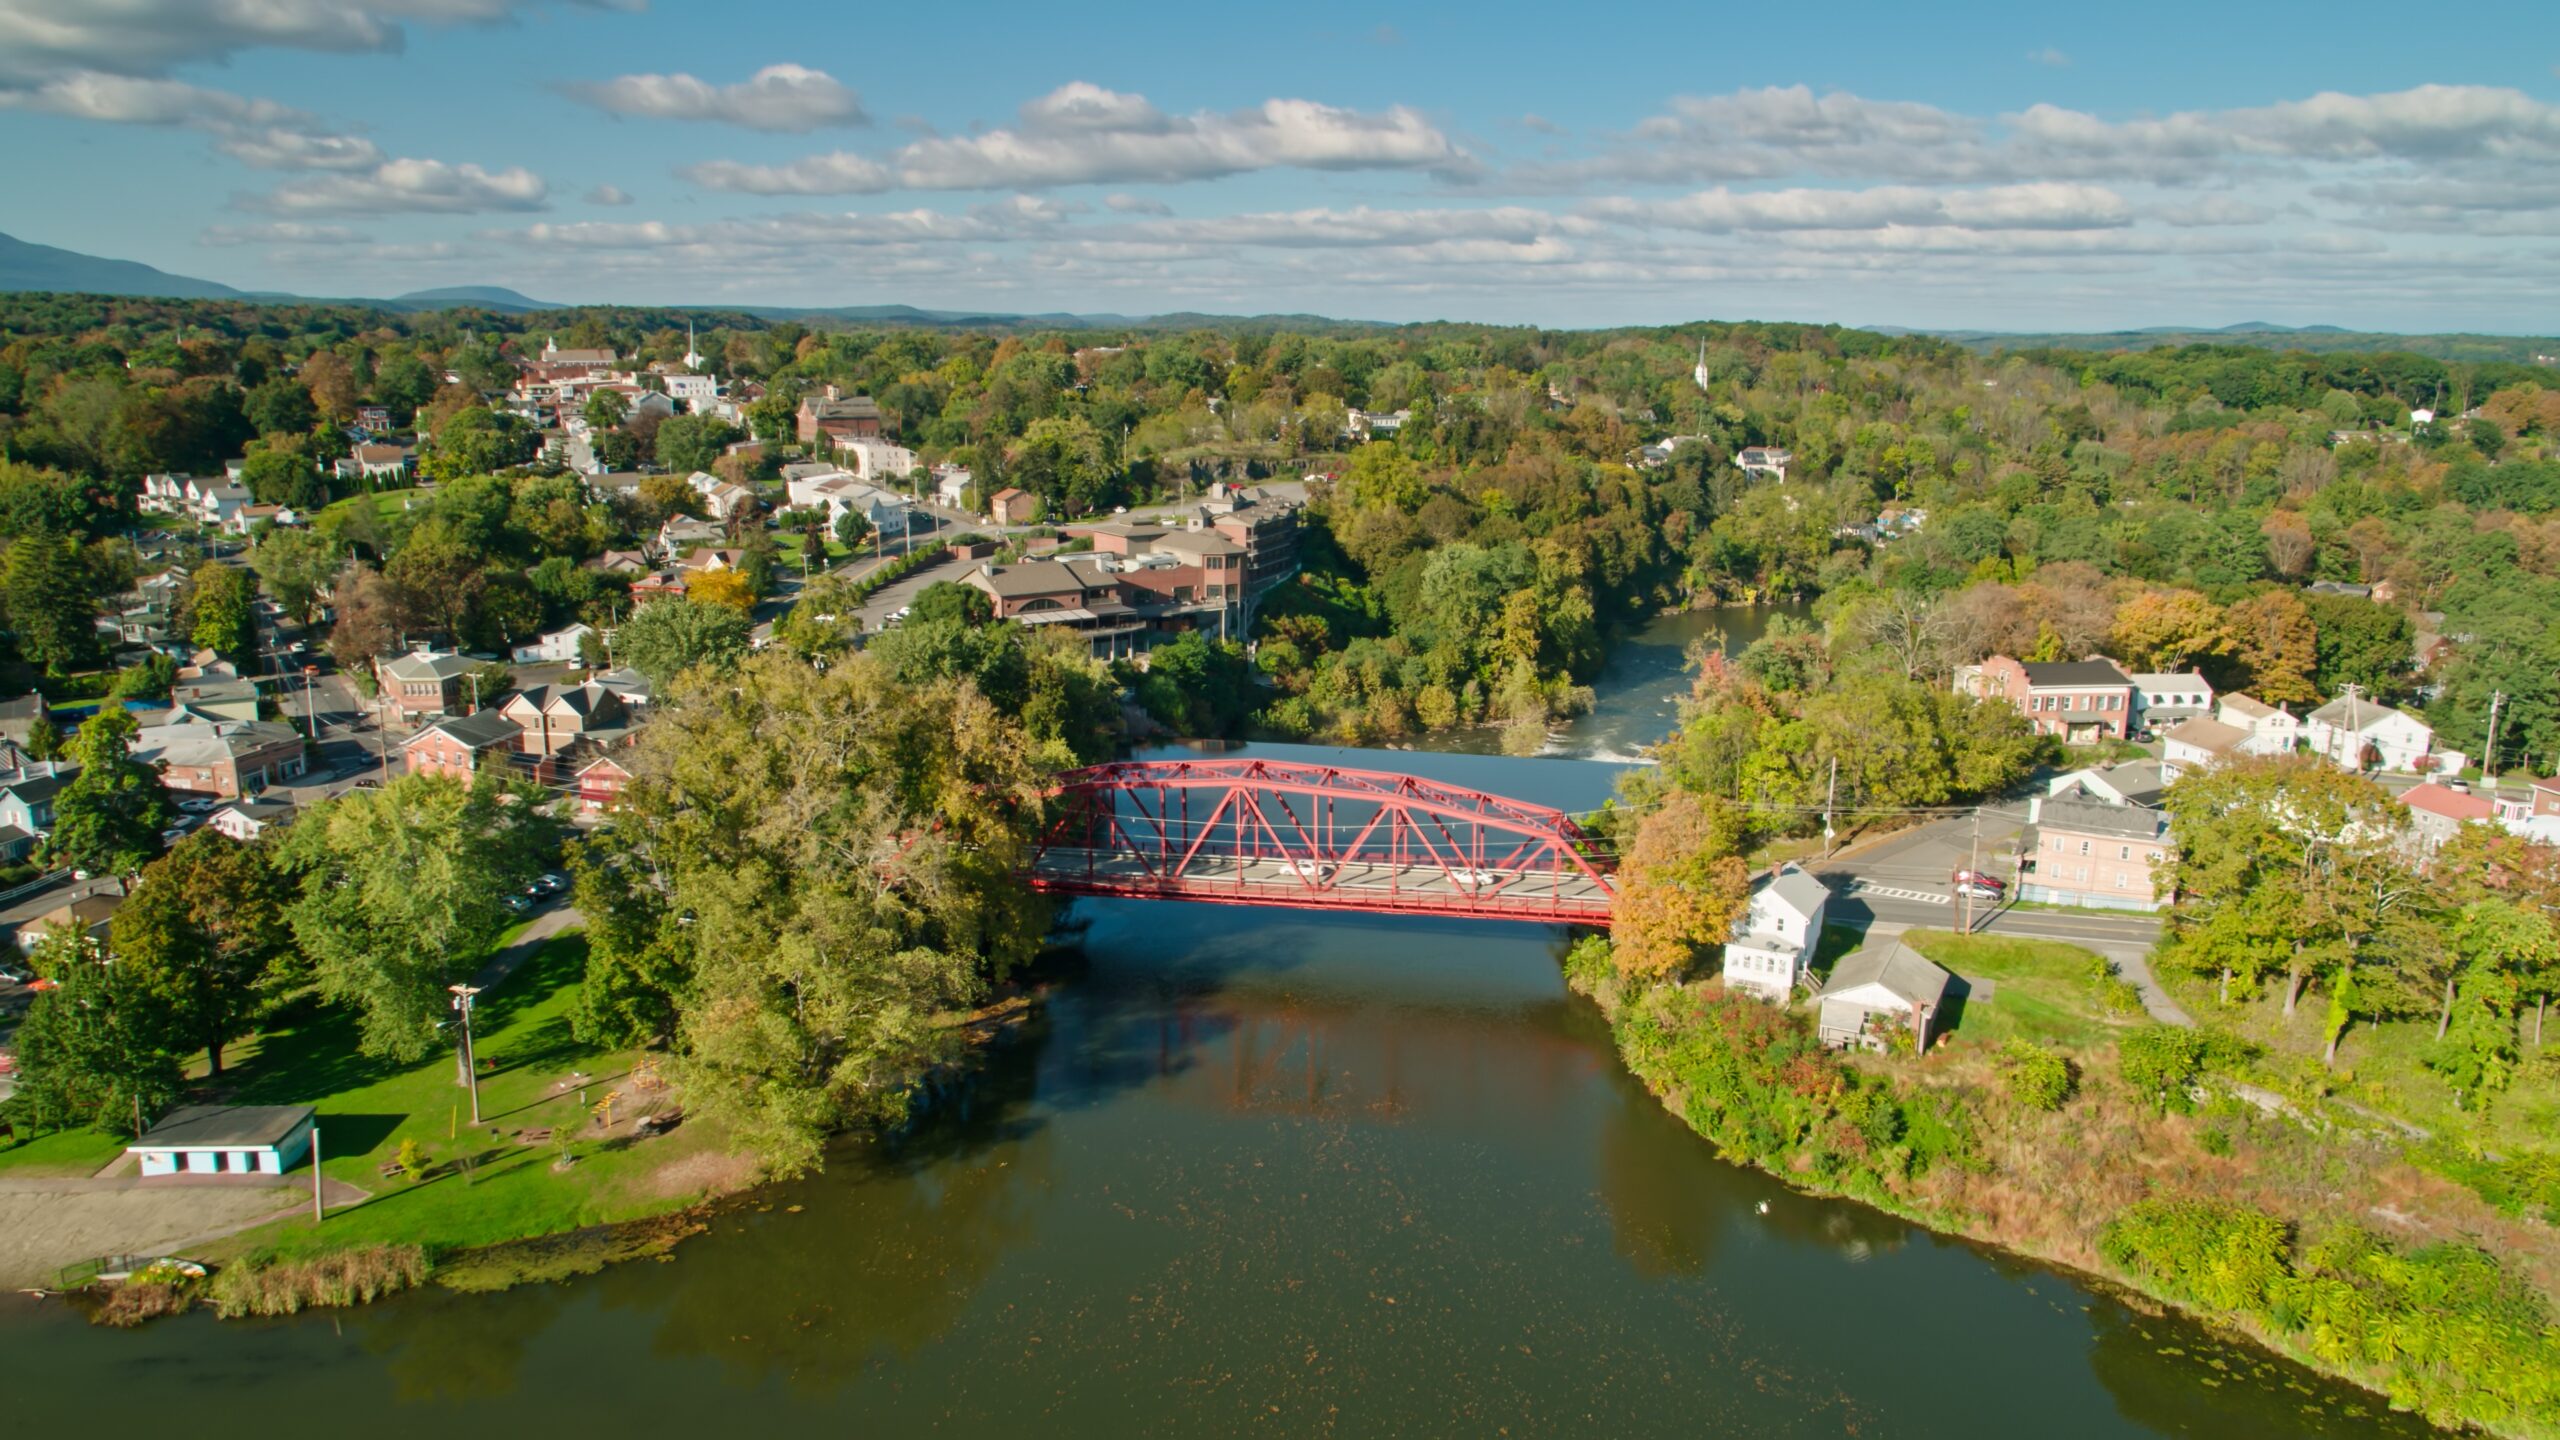
The Mid-Hudson sits at the crossroads of the valley’s identities. Dutchess County has dual appeal: as a commuter county within the broader New York City metro, and as an equestrian destination defined by stone walls, hunt clubs, and a luxury market built on the idea that some land is simply irreplaceable. Ulster County is the creative county, where Woodstock’s art colony legacy and the Catskill foothills draw buyers seeking mountain access, cultural density, and a landscape that has inspired painters since the 19th century. Orange County is the emerging county, the one where a buyer can still acquire something significant without paying the full premium that Dutchess and Ulster have built up over the past decade. Together, they form a Mid-Hudson that defies a single description, which is precisely why it continues to attract a wide range of buyers from New York City and beyond.
The Mid-Hudson area is made up of Dutchess, Orange, and Ulster counties, which is the Kiryas Joel-Poughkeepsie-Newburgh metro plus nearby Ulster County. Across the three, median listing prices are tightly clustered: Dutchess at $599,450 (+8.0% year-over-year), Ulster at $599,475 (+11.6%), and Orange at $569,975 (+9.6%). All three counties have seen meaningful year-over-year growth in median prices.
That regional divergence from the national trend becomes sharper when viewed over a longer window. From April 2019 to April 2026, Ulster’s luxury entry point grew by approximately 121%, Dutchess by 110%, and Orange by 85%, compared with national luxury growth of 38% over the same period. Ulster and Dutchess grew at roughly three times the national rate. Orange, despite being the most accessible of the three in terms of both price and commute time to New York City, still outpaced the national benchmark by more than double. All three counties crossed above the national luxury threshold of $1,274,423 during this period, a milestone that reflects both the depth of post-pandemic demand and the structural supply constraints of a market built almost entirely on existing homes rather than new construction.
Dutchess County leads the Mid-Hudson in total million-dollar listings with 117 properties, followed by Ulster’s 95, though Ulster carries a marginally higher share at 21% versus Dutchess’s 20%. Orange County, the most geographically expansive of the three and the closest to New York City via the I-87 corridor, has a more modest 10.5% million-dollar share, but its 90th-percentile threshold of $1,068,275 has climbed 7.7% year over year, suggesting its luxury tier is actively building. As featured in the April 2026 Luxury Housing Report, the Kiryas Joel-Poughkeepsie-Newburgh metro, which spans Orange and Dutchess counties, was highlighted as one of the more intriguing emerging luxury profiles in the Northeast, anchored by a corridor of estate-driven communities stretching from the equestrian farmlands of northern Dutchess County to the historic enclave of Tuxedo Park.
Ulster County, NY Getty Images
Ulster County’s luxury tier is the most expensive among the three at the upper end. Its 90th-percentile threshold of $1,761,750 is up 10.1% year over year, the strongest luxury-tier price growth in the Mid-Hudson. Luxury properties in Ulster, however, are taking considerably longer to sell: at the 90th percentile, days on market are 165, up 14.8% year over year.
The housing stock across all three Mid-Hudson counties reinforces the supply constraint story. Ulster leads the region with 12% of its active listings built before 1900, 12 times the national share, and 37% of its total stock built before 1950. Dutchess and Orange carry smaller pre-1900 shares (7% and 6%), but each has a meaningful concentration of postwar stock, with Dutchess peaking in the 1960s at 14% and Orange in the 1980s at 14%. Across all three counties, the 2020s share sits at 7% to 8%, less than half the national rate of 19%.
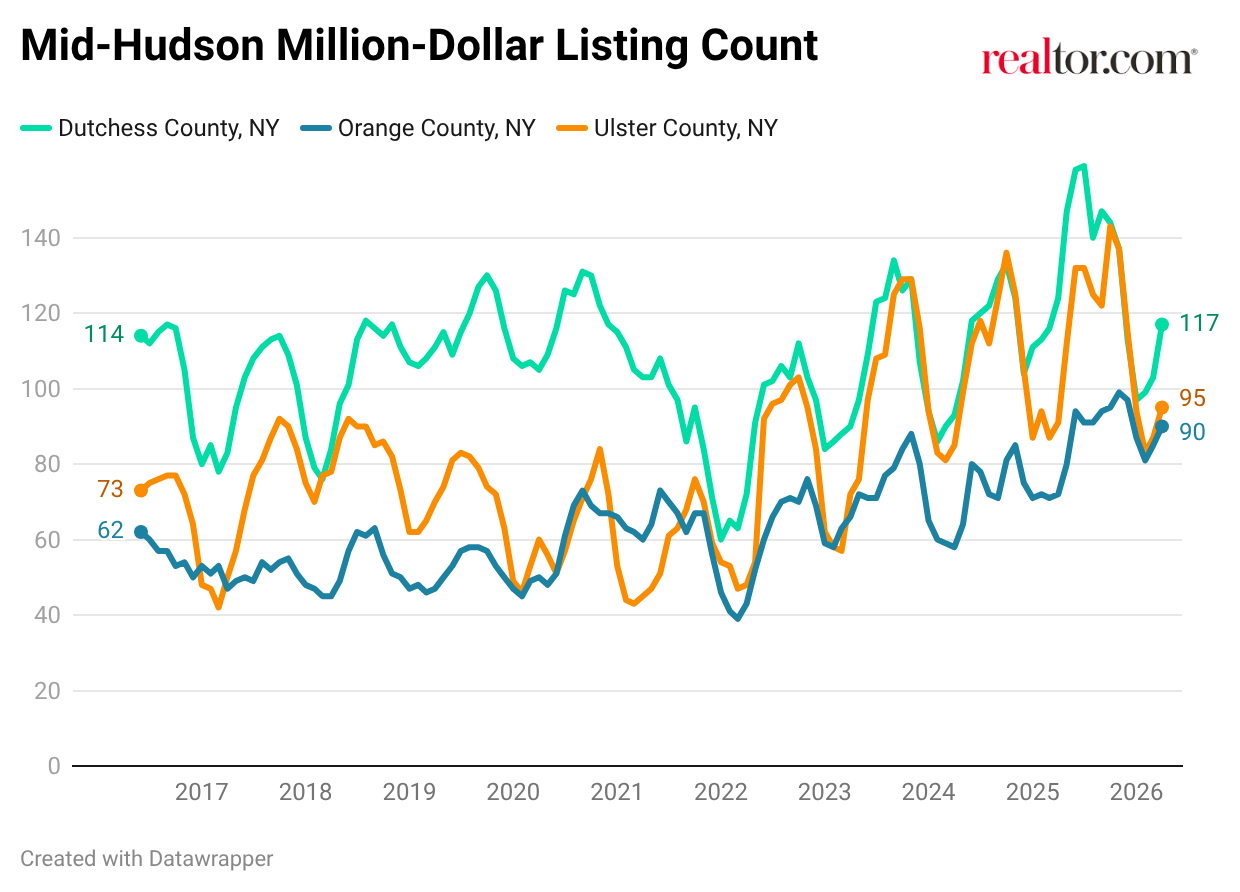
All three Mid-Hudson counties entered 2022 at elevated million-dollar counts, then pulled back sharply as mortgage rates climbed. Orange County hit a trough of 39 properties in early 2022, Ulster fell to 43, and Dutchess compressed to 60. What followed tells the story of the current market: all three have since recovered strongly, with each county reaching its highest million-dollar plus for-sale home listing counts of the decade by mid-to-late 2025. Orange peaked at 99 properties in November 2025, its highest level to date, representing a gain of roughly 60% from its 2016 baseline of 62. Ulster climbed from 73 properties in June 2016 to a high of 142 in October 2025, then settled to 95 in April 2026. Dutchess peaked at 158 in mid-2025 and currently sits at 117.
The consistency of that post-2022 recovery across all three counties reflects a market being rebuilt by appreciation of existing homes rather than by new supply.
Standout ZIP Codes: Dutchess County, NY
| ZIP | Area | Median Listing Price | Million-Dollar Share | Median Days on Market | Median Square Feet |
| 12567 | Pine Plains | $2,372,500 | 56.2% | 113 | 3,904 |
| 12514 | Clinton Corners | $1,496,250 | 68.8% | 38 | 3,427 |
| 12545 | Millbrook | $1,237,500 | 58.3% | 93 | 3,136 |
| 12572 | Rhinebeck | $846,500 | 41.7% | 39 | 2,175 |
| 12571 | Red Hook | $809,125 | 32.1% | 40 | 2,655 |
| 12508 | Beacon | $759,000 | 19.1% | 41 | 1,853 |
Pine Plains (12567) anchors the top of the Dutchess County table with a median of $2,372,500 and a million-dollar share of 56.2%. The 90th-percentile threshold of $6,883,000 reflects an upper tier defined by expansive acreage, historic structures, and a buyer profile drawn to the open farmland of northern Dutchess. At 3,904 median square feet and a 113-day days on market, properties here trade on estate timelines rather than conventional market logic.
Clinton Corners (12514) has the highest million-dollar share in the Mid-Hudson at 68.8%, with 38 days on market, making it one of the fastest-moving luxury ZIPs in the entire valley. Millbrook (12545) carries the highest 90th percentile of any Mid-Hudson ZIP at $11,977,500, a figure reflecting a small number of legacy estate properties at the top of a market defined by equestrian culture and generational land ownership. Rhinebeck (12572) and Red Hook (12571) both clear at 39 to 40 days on market, among the tightest pacing in the region. Beacon (12508), with a $759,000 median and 41-day pace, represents the Mid-Hudson’s most accessible entry into a market defined by Dia Beacon, a growing creative economy, and consistent demand from New York City buyers.
Standout ZIP Codes: Ulster County, NY
| ZIP | Area | Median Listing Price | Million-Dollar Share | Median Days on Market | Median Square Feet |
| 12484 | Stone Ridge | $1,711,750 | 66.7% | 190 | 2,478 |
| 12498 | Woodstock | $1,023,248 | N/A | 56 | 2,303 |
| 12404 | Accord | $848,125 | 40.0% | 34 | 2,205 |
| 12561 | New Paltz | $812,450 | 30.8% | 35 | 2,204 |
| 12446 | Kerhonkson | $645,000 | 33.3% | 117 | 1,836 |
Stone Ridge (12484) leads Ulster’s standout ZIPs with a median of $1,711,750, a 66.7% million-dollar share, and a 90th-percentile of $4,062,500, the highest in the county at the ZIP level. Its 45.7% year-over-year median growth is among the strongest single-ZIP price movements in the Mid-Hudson, driven by an upper tier of historic stone farmhouses, large properties, and buyers willing to pay for a product with no modern equivalent. The 190-day days on market reflect an estate-level market where the right buyer takes time to find the right property.

Woodstock, NY – Getty Images
Woodstock (12498) crossed the $1 million median threshold in the current period, a milestone that underscores its transition from a well-known arts community to a fully established luxury market. With top homes reaching over $2.6 million, and a 56-day days-on-market, Woodstock is now operating at a scale and pace that places it among Ulster’s core luxury destinations. Its identity as a cultural touchstone, with deep roots in the visual arts, music, and a creative economy that has attracted buyers for generations, gives it a demand profile that is less rate-sensitive than markets defined primarily by proximity and square footage.
Accord (12404) and New Paltz (12561) are the Mid-Hudson’s emerging fast movers in Ulster. Accord at 34 days and New Paltz at 35 are clearing luxury properties at a pace that rivals the faster ZIP codes in Dutchess. Accord’s 40% million-dollar share and a 90th-percentile of $1,897,500 reflect a market operating firmly in the luxury tier despite a relatively modest overall median. New Paltz benefits from the Shawangunk Mountains, a world-class rock-climbing destination; SUNY New Paltz, an academic and cultural anchor; and proximity to the Thruway, which keeps it accessible to New York City buyers.
Kerhonkson (12446) is one of the more instructive data points in Ulster. A median of $645,000 and a 90th percentile of $2,877,000 represent a spread of more than $2.2 million. Nine of 27 active listings are priced above $1 million. The pattern reflects an area where mid-tier and luxury properties coexist in the same market, and where buyers at the top end are purchasing properties that bear little resemblance, in scale, land, or character, to what the median number describes.
Standout ZIP Codes: Orange County
Tuxedo Park (10987) is Orange County’s most distinctive luxury market and one of the most historically significant residential communities in the United States. Incorporated as a private, gated village in 1886, it was developed by Pierre Lorillard IV as an enclave for New York’s industrial elite, and its architecture, from shingle-style cottages to Gilded Age mansions, reflects that origin. Today, 14 of 22 active listings are priced above $1 million, representing a 63.6% share of million-dollar listings. The higher end of listing prices here can exceed $5 million, indicating that the top of this market operates at a level above what its neighbors can match. The $1,221,250 median tells only part of the story: what trades in Tuxedo Park encompasses a range from gatehouses and smaller village properties to the kinds of significant estates that rarely appear on the market at all.
Fort Montgomery (10922), at the base of the Hudson Highlands where the river narrows, and Storm King Mountain rises on the opposite bank, posted the strongest year-over-year median growth in Orange County at 77.6%, reaching a median of $852,500. Its 31-day days-on-market, the fastest of any Orange County ZIP in this table, reflects a market where buyers are decisive. The Hudson Highlands setting, combined with proximity to West Point and direct river access, gives Fort Montgomery a geographic identity distinct from the broader Orange County landscape.
Goshen (10924), the county seat, sits at $791,075 with a 90th-percentile crossing $1,178,670, just above the national luxury benchmark. With a 35-day days on market and a growing concentration of million-dollar listings, Goshen illustrates Orange County’s broader story: a market actively building luxury depth, supported by price appreciation that has more than doubled the national rate since 2019.
Warwick (10990) has the highest luxury count in Orange County, with 16 active million-dollar listings and a 28% share. The township’s combination of preserved farmland, a historic village center, and proximity to both the Hudson Valley and the New York City metro has sustained consistent interest among buyers seeking substantial acreage without the full premium of Dutchess or Columbia counties.
Methodology
All data in this report is sourced from Realtor.com® listing trends as of April 2026, reflecting active inventory of existing homes, including single-family residences, condos, townhomes, row homes, and co-ops. Listings reflect only those provided by MLS platforms to Realtor.com through a listing feed. New-construction listings are excluded unless actively listed on participating MLSs.
Luxury segmentation is based on market-specific price percentiles, with the 90th percentile representing entry-level luxury, the 95th percentile marking high-end luxury, and the 99th percentile indicating ultraluxury. All calculations are based on listing prices, not final sales prices.
Metropolitan and micropolitan areas are defined using the Office of Management and Budget’s OMB-2023 delineations, with Claritas 2025 household estimates used for relative comparisons. Where appropriate, we limited analysis to metros or micros with a minimum threshold of active million-dollar listings on average over the past year to ensure meaningful comparisons.
Historical listing trend data extends to July 2016, but year-over-year comparisons in this report use March 2025 as the baseline.
Luxury by the Numbers
90th percentile = Entry-level luxury (top 10% of prices)
95th percentile = High-end luxury
99th percentile = Ultraluxury (often rare or custom properties)


