


Homeowners who are hoping to sell this year should start their engines, because the best time to sell a home in 2026 is approaching quickly.
The week of April 12-18 is expected to have the ideal balance of housing market conditions that favor home sellers, more so than any other week in the year. A recent survey from Realtor.com® found that the majority (53%) of home sellers took one month or less to get their home ready to list, so the time to start prepping is now.
This selection comes from looking at seasonal trends from 2018–25 data (excluding 2020), and calculating a Best Time To Sell score for each week of the year, based on a combination of housing metrics. Notably, mortgage rates are not included in the score as mortgage rate movement has more to do with the larger economic context, and does not follow a seasonal pattern.
Recent trends shape the 2026 housing market outlook
We expect the 2026 housing market to behave according to typical seasonality, but offer slightly better conditions than 2025, with modestly higher home sales and prices on average nationwide.
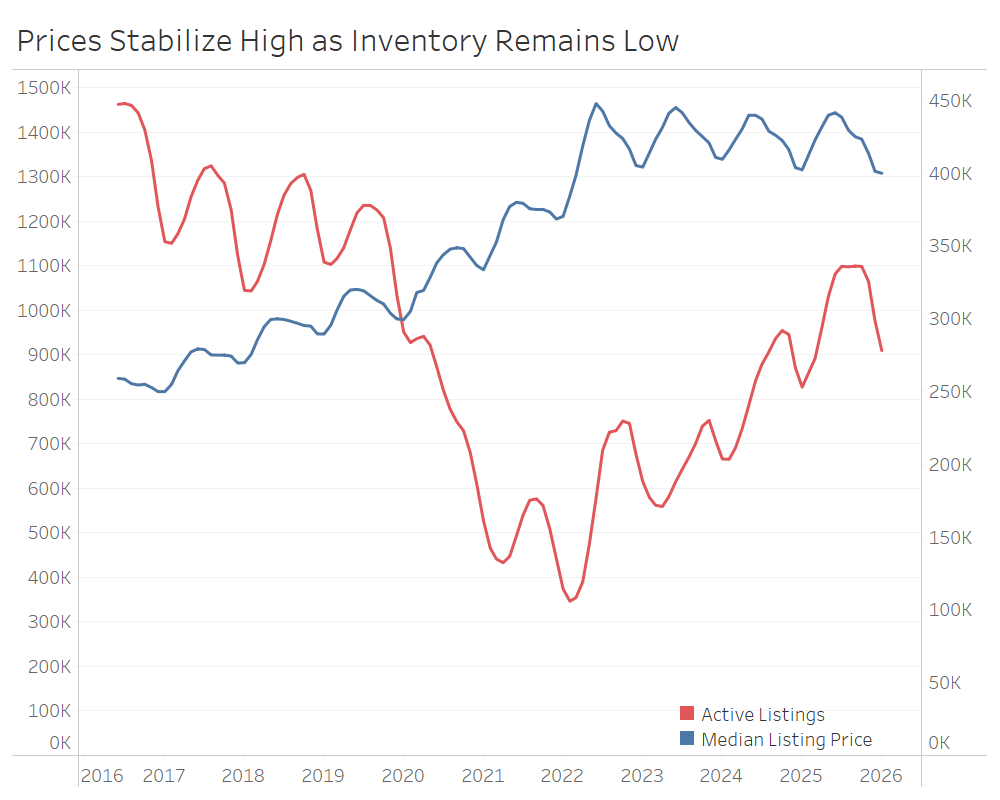
Affordability improved through 2025 as mortgage rates fell to the low 6% range by the fourth quarter of the year. Despite this improvement, home sales remained muted as households continued to grapple with affordability and widespread economic uncertainty. Home listing prices peaked for the year at a median of $440,000 nationally in May 2025, falling short of the previous year as well as 2022’s all-time high. Prices generally hovered near the previous year’s levels in 2025. Home prices have held relatively steady year over year since mid-2022, when climbing mortgage rates knocked some steam out of demand and price growth. Though stalling price growth has been a welcome change compared to COVID-19 pandemic-era price acceleration, it has not moved the needle much in terms of affordability nationally. Furthermore, home sales prices continued to climb, with the median home sale price hitting a new high in June 2025, highlighting diverging trends in what’s for sale (smaller, lower-priced homes) and what is selling (larger, higher-priced homes).
Aside from easing mortgage rates, the other bright spot in the 2025 housing market was inventory levels. There were more homes for sale in 2025 than in any year since the onset of the pandemic. Home prices remained high, but buyers in many markets saw more for-sale options, a slower market pace, and perhaps even more flexible sellers. Inventory growth did lose some steam through the year, however, as sellers, discouraged by weaker buyer activity, stayed on the sidelines or, in some cases, pulled their listings off the market.
As we enter the spring 2026 season, the housing market is beginning to seem more approachable for those who have been sidelined. While active inventory continues to grow year over year, the pace of that growth is starting to level off, creating a more stable environment for both buyers and sellers. This, combined with softening home prices and mortgage rates, is helping to rebuild purchasing power. These shifts are potentially paving the way for a more active spring as buyers find a market that finally feels within reach.
Benefits of listing April 12–18, 2026
At a national level, this week represents a balanced selection of market conditions that favor sellers. By balancing prices, inventory, demand, and market pace, sellers are expected to have a better-than-average selling experience by taking advantage of the best week. While affordability will continue to be a challenge, we expect lower mortgage rates and more inventory to inject some life back into the market.
Above-average prices: Homes during this week have historically reached prices 1.3% higher than the average week throughout the year, and are typically 6.6% higher than the start of the year. This year is likely to look a lot like the past few years seasonally, even as home price growth slows. If 2026 follows the previous years’ seasonal trends, the national median listing price could reach $5,300 above the average week, and $26,000 more than the start of the year.

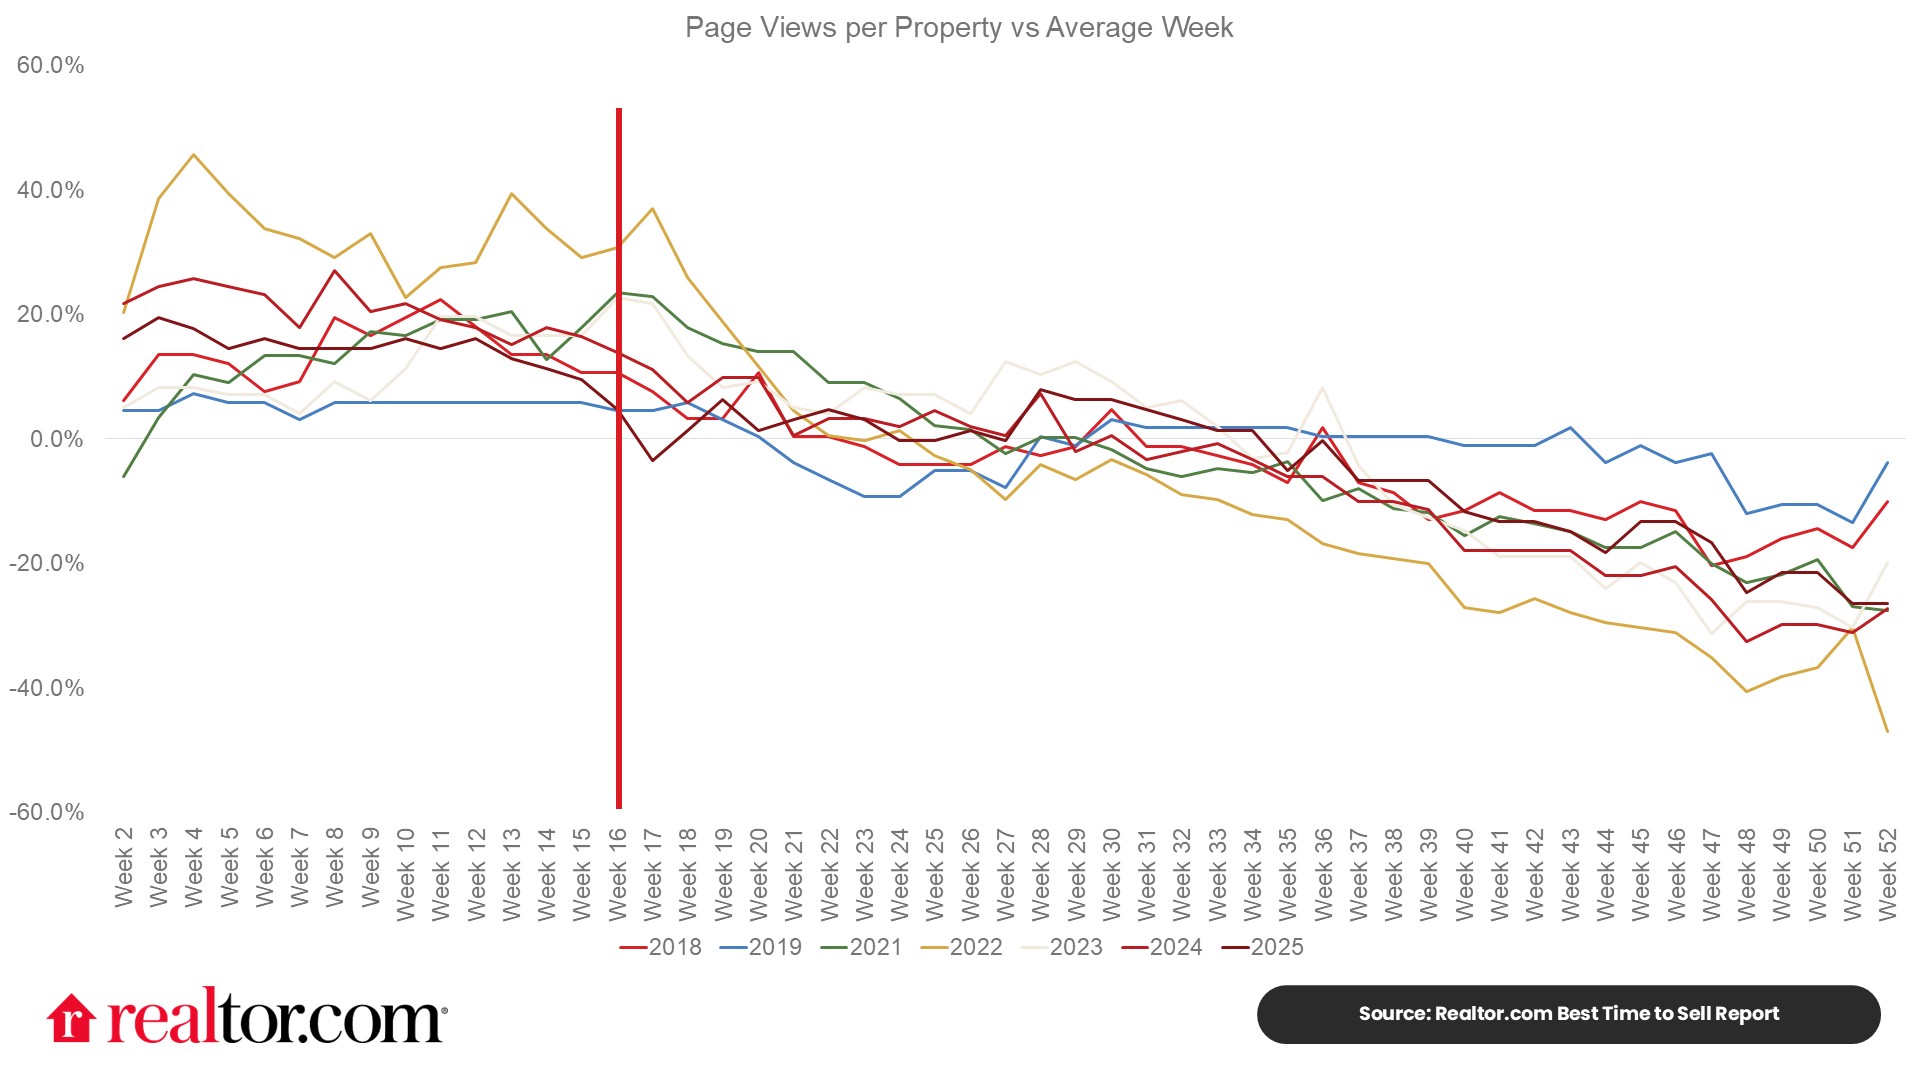
Above-average buyer demand: The number of buyers browsing a listing can determine how many offers a home gets and how quickly it sells. The more buyers looking at a home, the better for the seller, and in most years, buyers start earlier than sellers. Historically, this week garnered 16.7% more views per listing than the typical week, as elevated buyer activity is concentrated among a smaller number of homes for sale. Mortgage rates are near some of the lowest levels in nearly four years, which is likely to entice some eager buyers to reenter the market this spring, including some buyer-sellers who have seen market rates move closer to the rate they have on their outstanding mortgage.
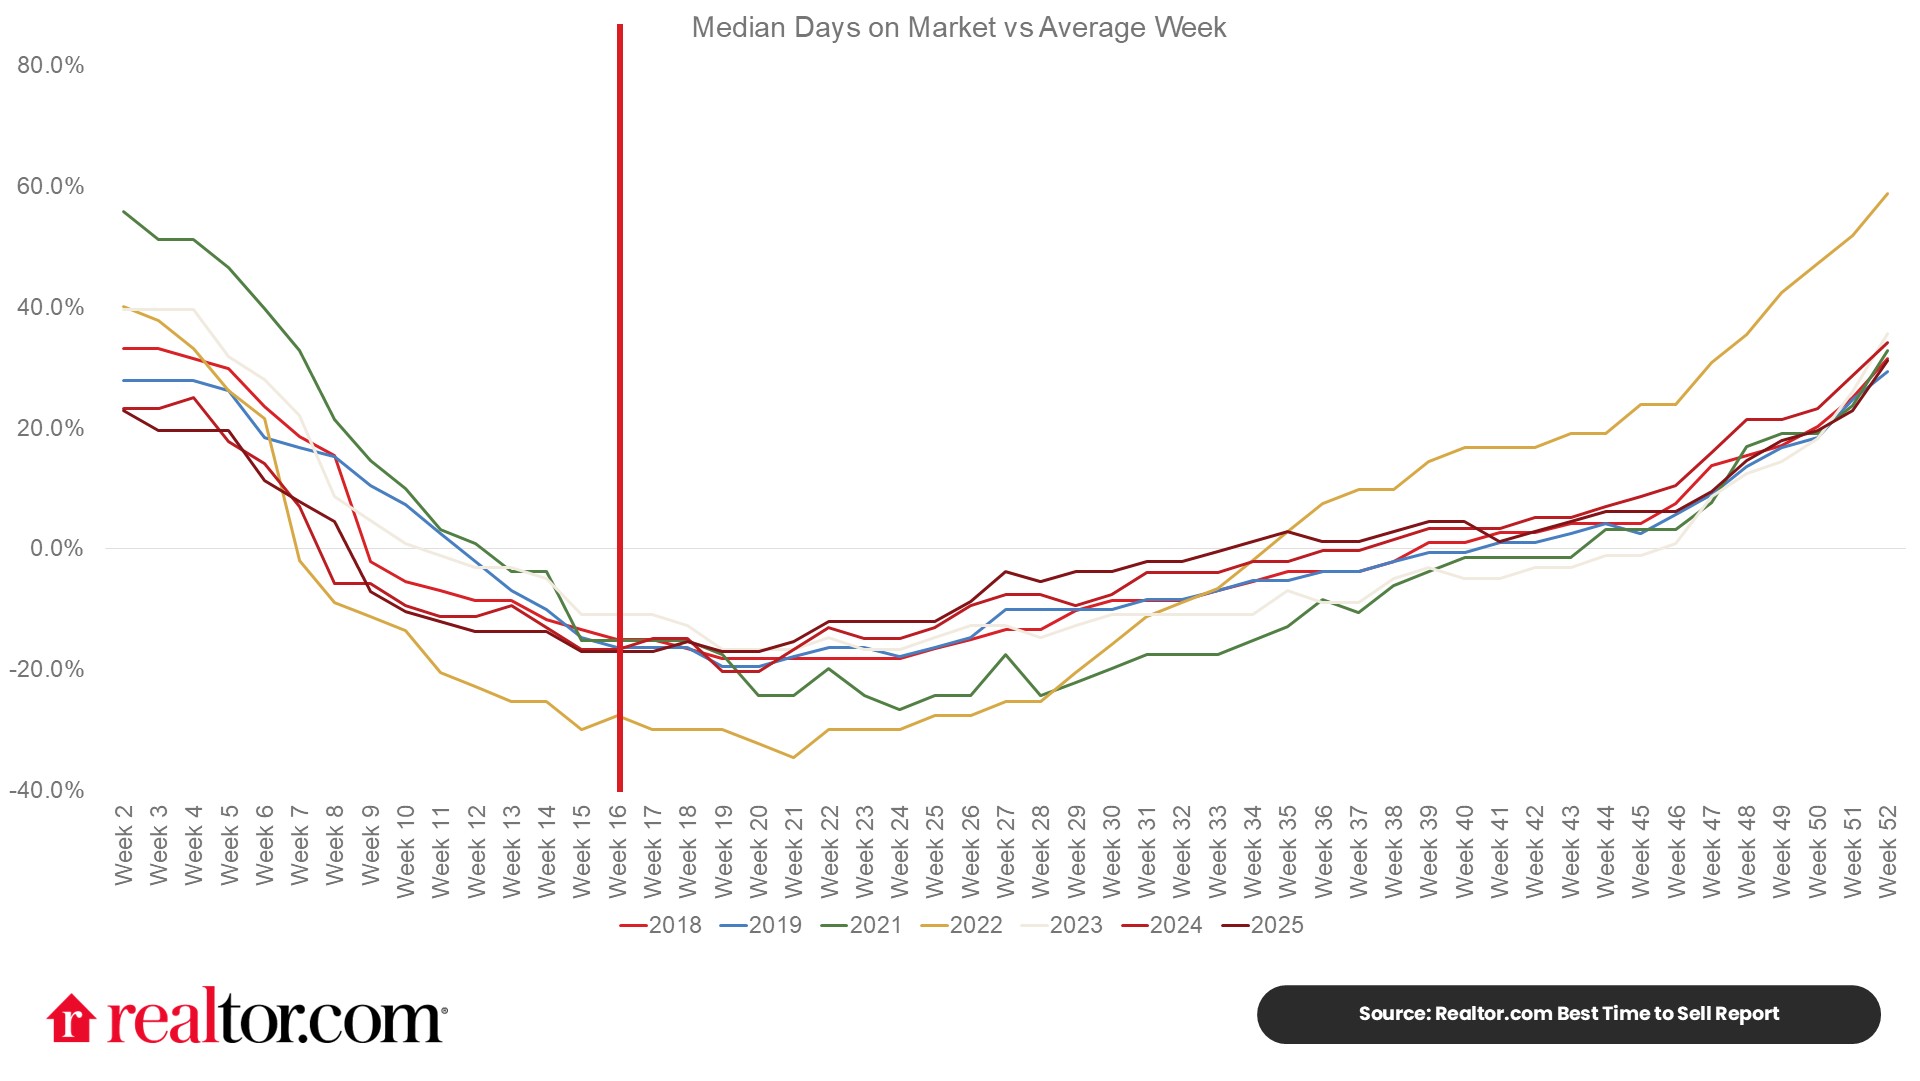
Quicker market pace: Thanks to above-average demand, homes sell more quickly during this week. Historically, homes actively for sale during this week were on the market for 17% less time, or roughly 9 days faster than the average week. In the 2025 market, this week saw homes typically on the market for 50 days, 10 days faster than the year’s average and 3 days faster than was typical in 2019. Market pace slowed in 2025 compared to the previous few years, but still-constrained demand in parts of the country means the typical home continued to sell faster than in the pre-pandemic period. So far in 2026, market pace has continued to slow, but if buyers seize on the opportunity of lower mortgage rates and demand picks up more quickly than inventory this spring, market pace could quicken as buyers vie for fewer homes.
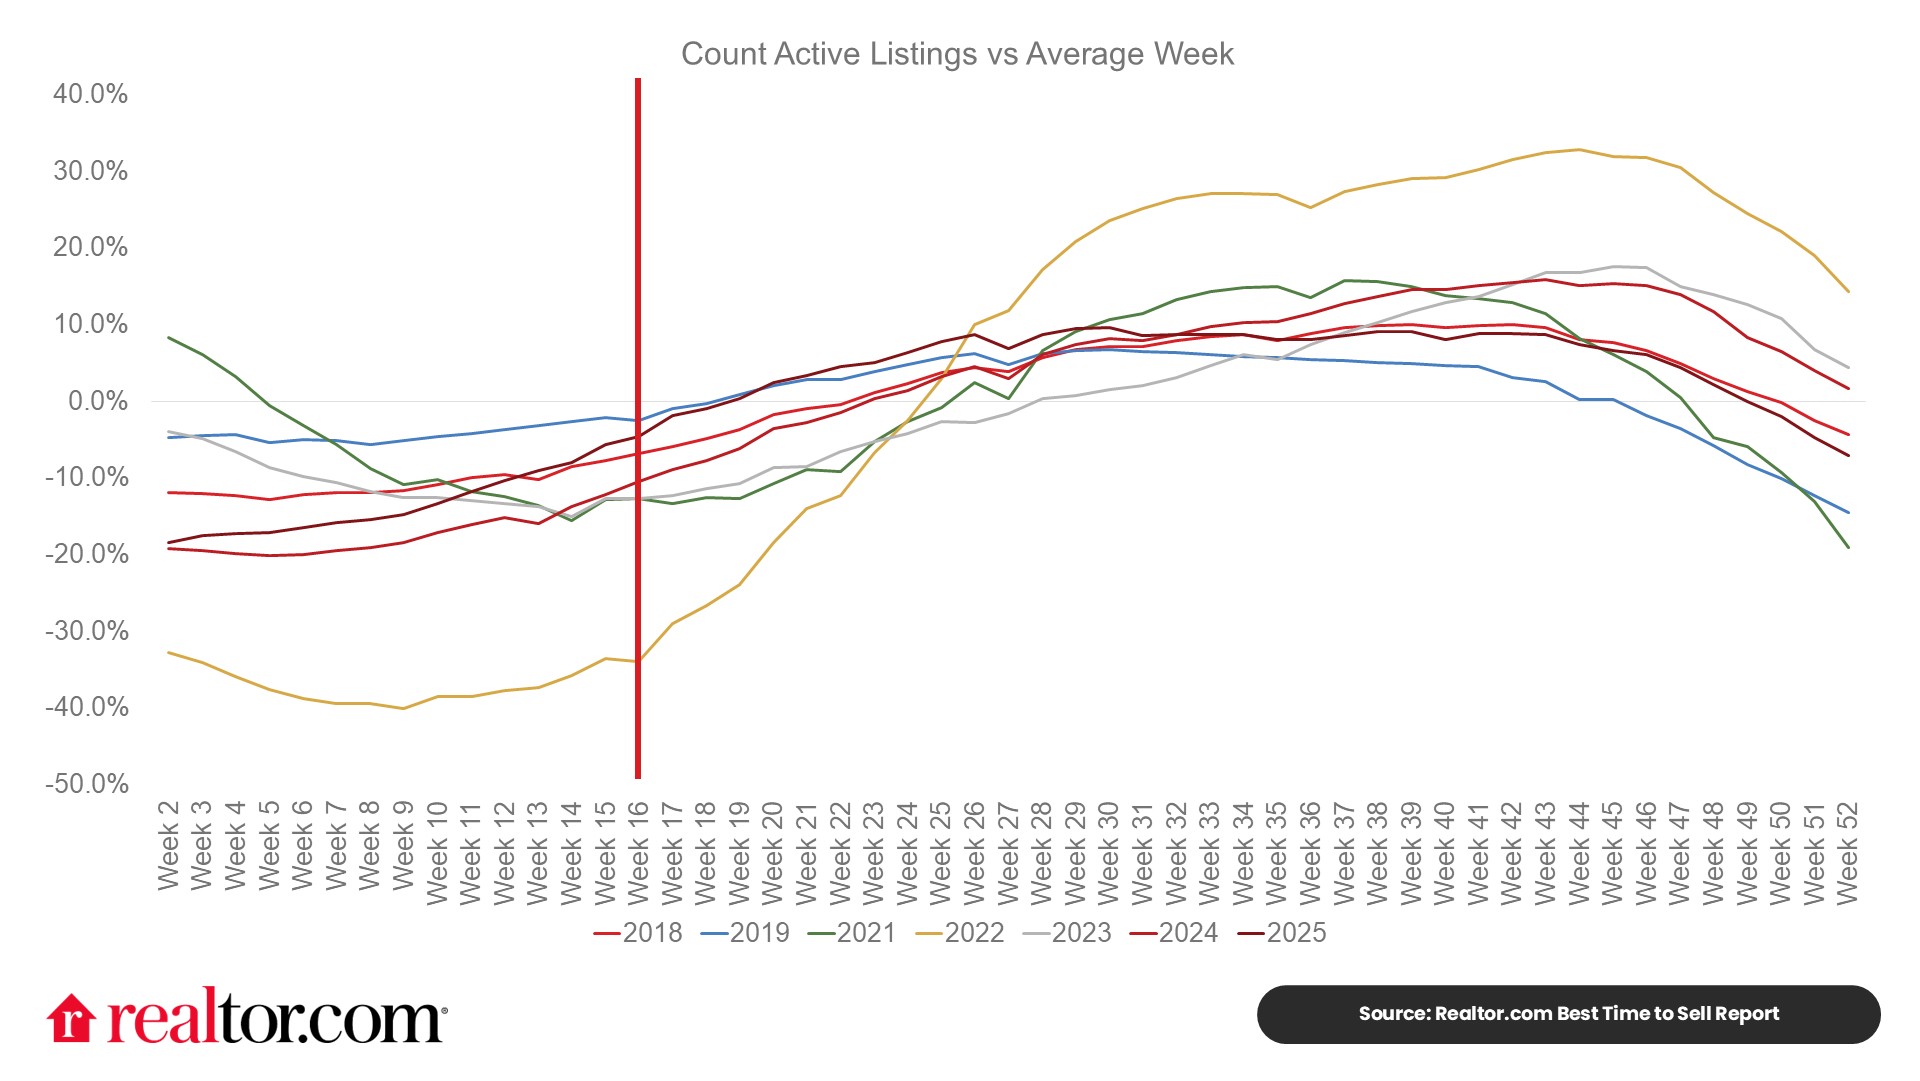
Lower competition from other sellers: A typical inventory trend would mean 11.9% fewer sellers on the market during this week compared to the average week throughout the year. Seller activity tends to climb from the beginning of the year until roughly November. In 2025, for-sale inventory reached its highest level since 2019, but remained below the pre-pandemic norm nationally and in many markets. Inventory gains continued into 2026, but progress has slowed with listings up just 7.9% year over year in February, and still 16.8% below typical 2017–19 levels, and a wide range of local market trends. This gap nationwide means there continue to be opportunities for sellers who enter the market this spring, even as local market variation will be an important context for homeowners planning to sell.
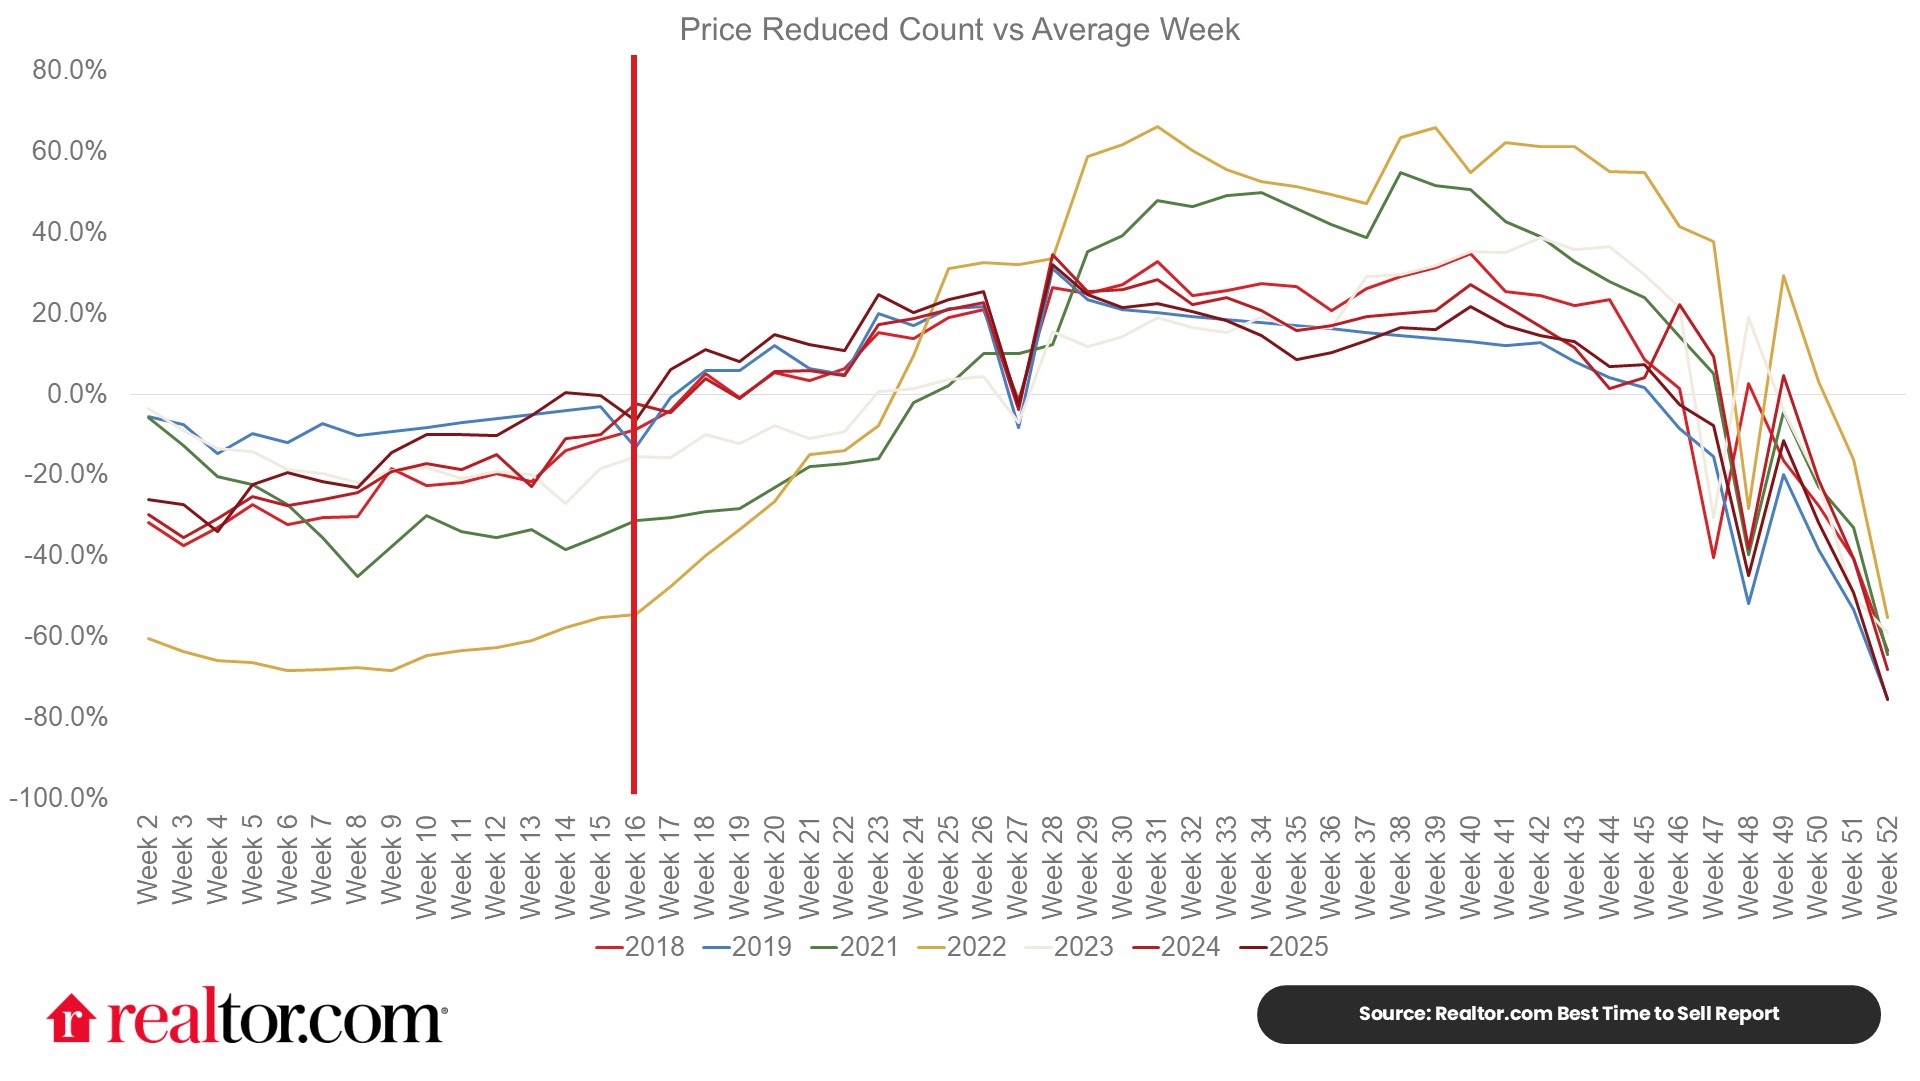
Below-average price reductions: Price reductions tend to peak in the fall as sellers left on the market after the summer rush compete to attract waning buyer attention. Conversely, the late winter and spring bring the year’s lowest level of price reductions as buyer activity ramps up. During the Best Week, roughly 18.9% fewer homes have had a price reduction than the average week of the year, which translates to a 0.7 percentage point lower price-reduced share compared to the average week of the year.
Economic uncertainty and shifting market dynamics
In 2025, home sales matched 2024’s nearly three-decade low as challenging affordability conditions kept buyers sidelined. However, seller activity climbed through 2025 as the lock-in effect continued to ease, as evidenced by the share of outstanding mortgages above 6% surpassing the share below 3%. Inventory levels were fortified by slow buyer activity, leading to a longer time on the market. Building inventory and slowing buyer activity meant that more sellers chose to reduce prices and even, in some cases, take their property off the market altogether, suggesting some markets have not yet reached a point of balance, where both buyers and sellers are willing to play ball.
Heading into the 2026 selling season, conditions look a bit better with lower mortgage rates than a year ago and more homes for sale, both of which can stoke buyer demand. This year’s housing market will hinge on improved affordability conditions, which will be highly dependent on falling mortgage rates and climbing inventory. Additionally, ongoing economic and geopolitical uncertainty may shape household behavior, including their choice to take on a home purchase.
-
- Mortgage rates are expected to remain below year-ago levels. Mortgage rates fell to the low 6% range by the end of 2025, and even dropped into the 5% range for one week this year. Altogether, buyers have faced nearly 3.5 years of 6%-plus mortgage rates, and downward progress is a much-welcomed development. As mortgage rates ease this year, volatility could make the path lower a bit bumpy. Sellers and buyers would be wise to rate-proof their budgets by planning their reactions to a sudden uptick or easing of rates.
- Prices tend to peak later, as does competition. Sellers should consider that peak prices later in the season also come with greater competition from other sellers for a similar-sized pool of buyers. Historically, by the end of June, while prices reached near-peak levels (+11% in 2025) compared to the start of the year, new sellers also surged, increasing to nearly 1.4 times the level at the start of the year (+38.4%). More sellers in the market is great for buyers, but less stellar for other sellers. Homeowners hoping to sell this year can mitigate that risk by getting into the market early, raising their odds of finding an eager buyer.
- Uncertainty could continue to factor into buyer and seller confidence. Tariff policy, geopolitical uncertainty, and inflation and other macroeconomic risks are just a few factors contributing to possible hesitation in making big financial moves in 2026. While we expect typical seasonal patterns to prevail, unexpected developments on any of these fronts have the potential to shake buyer and seller confidence or shock financial markets, leading to interest rate volatility.
What does this mean for sellers?
While we’ve identified April 12-18 as the best week to list for sellers, the housing market remains undersupplied, especially in the Northeast and Midwest. So a seller listing a well-priced, move-in-ready home is likely to find success even if they’re not optimizing for the best week of the year. Conversely, in the South and West, where for-sale inventory is more abundant, potential sellers face softer conditions and may see a bigger payoff from optimizing the timing of their home sale to the best week that falls in the early spring high season for real estate activity. Sellers who plan to optimize their list date will want to remember that finding a Realtor® agent and preparing a home for sale is a process, so they’ll need to get started well before their intended listing date.
What does this mean for homebuyers?
Market conditions improved in 2025, especially toward the end of the year, as mortgage rates reached the low 6% range. Even though inventory has not yet returned to pre-pandemic levels nationwide, there are more homes for sale than in the past few years, which means the market pace is a bit more manageable—with longer days on the market—and many sellers are more flexible—as shown in higher shares of homes with price reductions. Though buyers face still-high housing costs, they may find a bit more slack in the market, which could give them more time to make a decision than is typical in the busy spring and summer months, which is a good reason to get started early in 2026. Historically, the number of views per listing cools in the late summer/early fall and competition tends to ease for buyers from that point forward, which is a reason that the best time to buy tends to occur in the fall.
Local flavor: Why your ‘best week’ might be sooner (or later) than you think
While our national data points to the week of April 12–18 as the “Goldilocks” window for sellers, real estate has always been, and remains, local. Depending on where you live, your optimal listing window could already be opening, or it might still be a few frosts away.
The early birds: High-demand tech & coastal hubs
In many high-demand markets like San Jose, Boston, and Seattle, the spring market actually kicks off much earlier. In these metros, savvy sellers often list in early to mid-March to get ahead of the surge. Because inventory in these hubs remains tight, listing early allows you to capture “high-intent” buyers who have been scouring the limited listings all winter. In San Jose, for instance, listing just a few weeks early can correlate to a significantly higher price premium because you’re the only “fresh” house on the block.
The steady climbers: Midwest and Northeast ‘value’ markets
Markets in the Midwest (like Milwaukee or Grand Rapids) and parts of the Northeast (like Hartford) are seeing some of the highest demand in the country because they remain relatively affordable and desirable, and supply in these markets is still quite limited. In these areas, the Best Week tends to align more closely with the national average in mid-April.
The Sun Belt shift
We’re also watching a shift in the South and West. Markets like Austin and Phoenix are seeing inventory back above pre-pandemic levels and, as a result, more leverage among buyers. For sellers in these metros, the Best Week is about letting seasonal trends work for you. With more competition from other sellers across the calendar year, the mid-April window is your best bet because it’s when early buyers are excited to get going, giving you the best chance to find a match.
Best Time To List: 50 Largest Metro Areas
| Market | Best Week Start Date | Listing Price vs. Start of Year | Listing Price Change vs. Start of Year ($) | Views per Property vs. Avg Week | Price Reductions vs. Avg Week | Days on Market vs. Avg Week | Active Listings vs. Avg Week |
| United States | 4/12/2025 | 6.6% | $26,000 | 16.7% | -20.5% | -9 days | -12.8% |
| Atlanta-Sandy Springs-Roswell, GA | 4/12/2026 | 6.7% | $27,000 | 18.7% | -15.4% | -8 | -10.1% |
| Austin-Round Rock-San Marcos, TX | 4/12/2026 | 9.1% | $41,000 | 26.3% | -8.0% | -15 | -10.2% |
| Baltimore-Columbia-Towson, MD | 3/15/2026 | 5.9% | $21,000 | 22.5% | -25.0% | -7 | -14.8% |
| Birmingham, AL | 5/10/2026 | 10.5% | $30,000 | 12.4% | 0.4% | -11 | -6.2% |
| Boston-Cambridge-Newton, MA-NH | 3/8/2026 | 8.7% | $69,000 | 25.6% | -46.0% | -10 | -22.9% |
| Buffalo-Cheektowaga, NY | 4/12/2026 | 15.2% | $39,000 | 35.4% | -37.8% | -10 | -22.0% |
| Charlotte-Concord-Gastonia, NC-SC | 4/12/2026 | 5.6% | $23,000 | 18.4% | -17.8% | -10 | -11.7% |
| Chicago-Naperville-Elgin, IL-IN | 3/22/2026 | 9.9% | $35,000 | 18.0% | -23.3% | -5 | -15.2% |
| Cincinnati, OH-KY-IN | 3/29/2026 | 14.7% | $50,000 | 17.5% | -27.6% | -6 | -18.6% |
| Cleveland, OH | 4/12/2026 | 15.9% | $39,000 | 20.3% | -25.0% | -7 | -16.6% |
| Columbus, OH | 3/22/2026 | 9.8% | $34,000 | 34.1% | -45.6% | -9 | -25.9% |
| Dallas-Fort Worth-Arlington, TX | 4/12/2026 | 5.8% | $24,000 | 23.5% | -20.0% | -9 | -14.6% |
| Denver-Aurora-Centennial, CO | 3/8/2026 | 5.6% | $31,000 | 35.2% | -44.2% | -12 | -30.0% |
| Detroit-Warren-Dearborn, MI | 4/12/2026 | 13.6% | $32,000 | 32.0% | -34.6% | -6 | -21.3% |
| Grand Rapids-Wyoming-Kentwood, MI | 3/29/2026 | 8.4% | $34,000 | 22.6% | -54.3% | -5 | -27.2% |
| Hartford-West Hartford-East Hartford, CT | 3/15/2026 | 6.4% | $28,000 | 27.2% | -26.4% | -6 | -14.3% |
| Houston-Pasadena-The Woodlands, TX | 4/12/2026 | 5.4% | $19,000 | 17.5% | -13.0% | -7 | -9.1% |
| Indianapolis-Carmel-Greenwood, IN | 5/3/2026 | 15.8% | $49,000 | 24.5% | -17.9% | -11 | -16.6% |
| Jacksonville, FL | 3/22/2026 | 5.3% | $20,000 | 24.7% | -15.5% | -7 | -9.8% |
| Kansas City, MO-KS | 3/22/2026 | 7.3% | $28,000 | 18.2% | -35.3% | -4 | -18.7% |
| Las Vegas-Henderson-North Las Vegas, NV | 3/22/2026 | 3.6% | $17,000 | 31.6% | -24.4% | -7 | -18.2% |
| Los Angeles-Long Beach-Anaheim, CA | 3/22/2026 | 7.0% | $73,000 | 20.0% | -22.2% | -5 | -13.9% |
| Louisville/Jefferson County, KY-IN | 4/26/2026 | 10.5% | $32,000 | 15.0% | -35.6% | -5 | -17.4% |
| Memphis, TN-MS-AR | 5/3/2026 | 9.0% | $27,000 | 10.3% | -10.5% | -8 | -11.2% |
| Miami-Fort Lauderdale-West Palm Beach, FL | 5/24/2026 | 5.1% | $26,000 | 3.0% | -1.7% | -2 | -2.6% |
| Milwaukee-Waukesha, WI | 3/22/2026 | 9.2% | $34,000 | 21.9% | -46.5% | -5 | -13.1% |
| Minneapolis-St. Paul-Bloomington, MN-WI | 3/15/2026 | 6.6% | $27,000 | 23.3% | -41.0% | -6 | -22.3% |
| Nashville-Davidson–Murfreesboro–Franklin, TN | 4/12/2026 | 6.8% | $36,000 | 21.6% | -17.5% | -8 | -14.3% |
| New York-Newark-Jersey City, NY-NJ | 3/22/2026 | 4.6% | $34,000 | 18.3% | -18.2% | -10 | -7.7% |
| Oklahoma City, OK | 3/8/2026 | 4.5% | $14,000 | 18.4% | -42.2% | 0 | -13.7% |
| Orlando-Kissimmee-Sanford, FL | 4/19/2026 | 5.0% | $21,000 | 23.3% | -5.4% | -7 | -9.8% |
| Philadelphia-Camden-Wilmington, PA-NJ-DE-MD | 3/22/2026 | 5.1% | $18,000 | 19.8% | -16.8% | -7 | -9.8% |
| Phoenix-Mesa-Chandler, AZ | 4/19/2026 | 5.4% | $27,000 | 18.3% | -3.1% | -4 | -1.4% |
| Pittsburgh, PA | 4/5/2026 | 10.8% | $26,000 | 21.4% | -19.1% | -9 | -13.5% |
| Portland-Vancouver-Hillsboro, OR-WA | 3/22/2026 | 3.1% | $18,000 | 25.9% | -35.6% | -9 | -25.2% |
| Providence-Warwick, RI-MA | 4/12/2026 | 6.3% | $34,000 | 19.8% | -33.7% | -7 | -16.5% |
| Raleigh-Cary, NC | 4/12/2026 | 5.7% | $25,000 | 21.6% | -22.5% | -10 | -13.4% |
| Richmond, VA | 4/12/2026 | 7.4% | $31,000 | 20.0% | -19.0% | -7 | -11.6% |
| Riverside-San Bernardino-Ontario, CA | 3/22/2026 | 2.7% | $16,000 | 27.4% | -17.3% | -4 | -12.9% |
| Sacramento-Roseville-Folsom, CA | 3/22/2026 | 4.6% | $28,000 | 26.1% | -33.6% | -8 | -24.9% |
| San Antonio-New Braunfels, TX | 4/19/2026 | 4.8% | $15,000 | 22.4% | -11.3% | -8 | -11.3% |
| San Diego-Chula Vista-Carlsbad, CA | 3/22/2026 | 5.4% | $48,000 | 20.4% | -29.1% | -5 | -17.5% |
| San Francisco-Oakland-Fremont, CA | 3/22/2026 | 11.6% | $104,000 | 18.5% | -27.2% | -7 | -16.4% |
| San Jose-Sunnyvale-Santa Clara, CA | 3/8/2026 | 11.4% | $148,000 | 18.3% | -32.4% | -10 | -19.1% |
| Seattle-Tacoma-Bellevue, WA | 3/29/2026 | 10.2% | $76,000 | 22.0% | -52.3% | -10 | -30.5% |
| St. Louis, MO-IL | 3/22/2026 | 8.1% | $23,000 | 17.4% | -21.0% | -4 | -13.3% |
| Tampa-St. Petersburg-Clearwater, FL | 4/19/2026 | 6.2% | $25,000 | 26.2% | -1.4% | -7 | -6.8% |
| Tucson, AZ | 5/3/2026 | 7.1% | $27,000 | 11.3% | -10.2% | -5 | -6.9% |
| Virginia Beach-Chesapeake-Norfolk, VA-NC | 4/19/2026 | 6.4% | $26,000 | 19.4% | -12.5% | -8 | -4.8% |
| Washington-Arlington-Alexandria, DC-VA-MD-WV | 3/22/2026 | 7.1% | $39,000 | 18.1% | -29.0% | -9 | -15.2% |
Methodology
Listing metrics (e.g., list prices) from 2018–19 and 2021–25 were measured on a weekly basis, with each week compared against a benchmark from the first full week of the year. Due to the onset of the COVID-19 pandemic, 2020 was an uncharacteristic year and has therefore been excluded from the analysis. Averaging across the years yielded the “typical” seasonal trend for each metric. Percentile levels for each week were calculated along each metric (prices, listings, days on the market, etc.), and were then averaged together across metrics to determine a Best Time To List score for each week. Rankings for each week were based on these Best Time To List scores.
Each week was scored based on favorability toward sellers—this included competition from other sellers (active listings and new listings), listing prices, market pace (days on the market), likelihood of price reductions, and homebuyer demand (views per property on Realtor.com). Percentile levels for each week were calculated along each metric and were then averaged together across metrics to determine a Best Time To Sell score for each week. Rankings for each week were based on these Best Time To Sell scores.


