


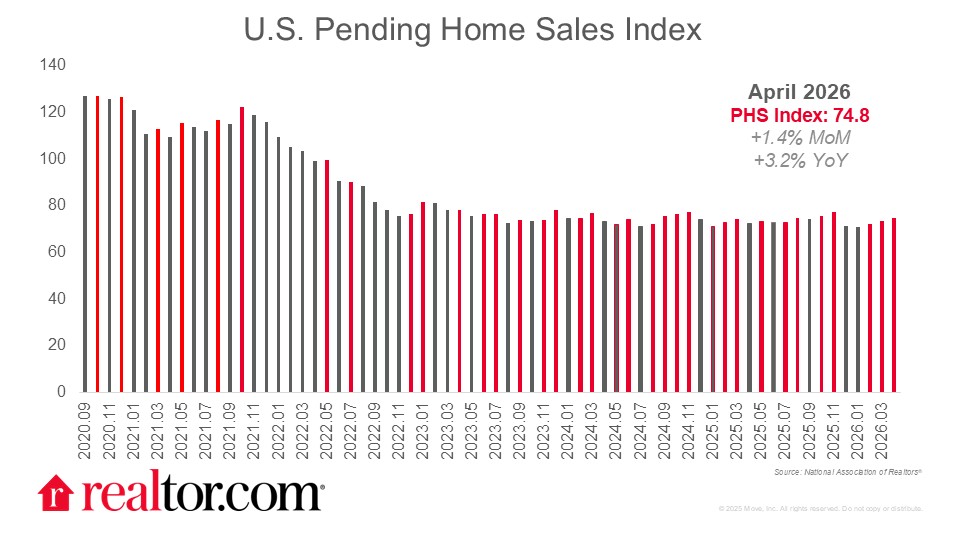
What did pending home sales look like in April?
Pending home sales picked up 1.4% in April as buyers capitalized on a growing selection of for-sale inventory and easing price growth. Contract signings grew 3.2% annually, a clear indication that the market is finding more balance during this spring season. Rates fell through the month after a turbulent start, dropping from a seven-month high of 6.46% to as low as 6.23% before ending around 6.3%, roughly half a percentage point below where they stood a year ago. That year-over-year advantage has preserved some buying power, though ongoing geopolitical uncertainty and economic anxiety have kept a lid on enthusiasm.
For-sale inventory improved 4.6% annually in April, though the rate of improvement continued to slow. New listings climbed 1.1% annually and picked up 8.7% month over month as asking prices continued to ease, now down year over year for six consecutive months. The share of active listings with a price reduction actually declined year over year, suggesting sellers are adjusting expectations before listing rather than after. Taken together, the April data reflects a seller cohort willing to engage and doing so with more realistic pricing, a meaningful contrast to last spring’s standoff.
What does this mean for buyers, sellers, and the housing market?
Pending home sales, or contract signings between buyers and sellers, mark the first formal step in the homebuying process and typically lead closings by one to two months, making them a useful gauge of near-term activity. The slight uptick in March pending sales translated into modestly positive Existing Home Sales in April.
Regionally, the picture was nearly all positive in April. The Northeast led the way with a 6.6% monthly gain, followed by the Midwest (+3.0%), and the West (+0.4%), while the South notched a slight monthly decrease (-0.7%). On an annual basis, the South saw the strongest growth (+4.7%), followed by the West (+4.7%), and the Midwest (+2.7%), while the Northeast saw a slight annual contraction (-0.7%). At the metro level, Boston (+10.3%), Miami (+9.4%), and Oklahoma City (+8.6%) led all major markets in year-over-year pending sales growth.
Looking ahead, the market is watching the inflation picture closely. April’s Consumer Price Index rose 3.8% annually, the highest reading in nearly three years, and core inflation accelerated to 2.8% as elevated energy costs began filtering into other categories. Higher inflation generally puts upward pressure on mortgage rates, which have already started drifting back above 6.3% in early May. Beyond rates, inflation running ahead of wage growth means household budgets are being squeezed, a dynamic that could dampen buyer confidence heading into the traditionally active summer months.


